
On 25 February 2021, the Clean Energy Regulator published the annual National Greenhouse and Energy Reporting (NGER) data for the 2019–20 reporting year.
For the 2019–20 year, corporations reported a total of:
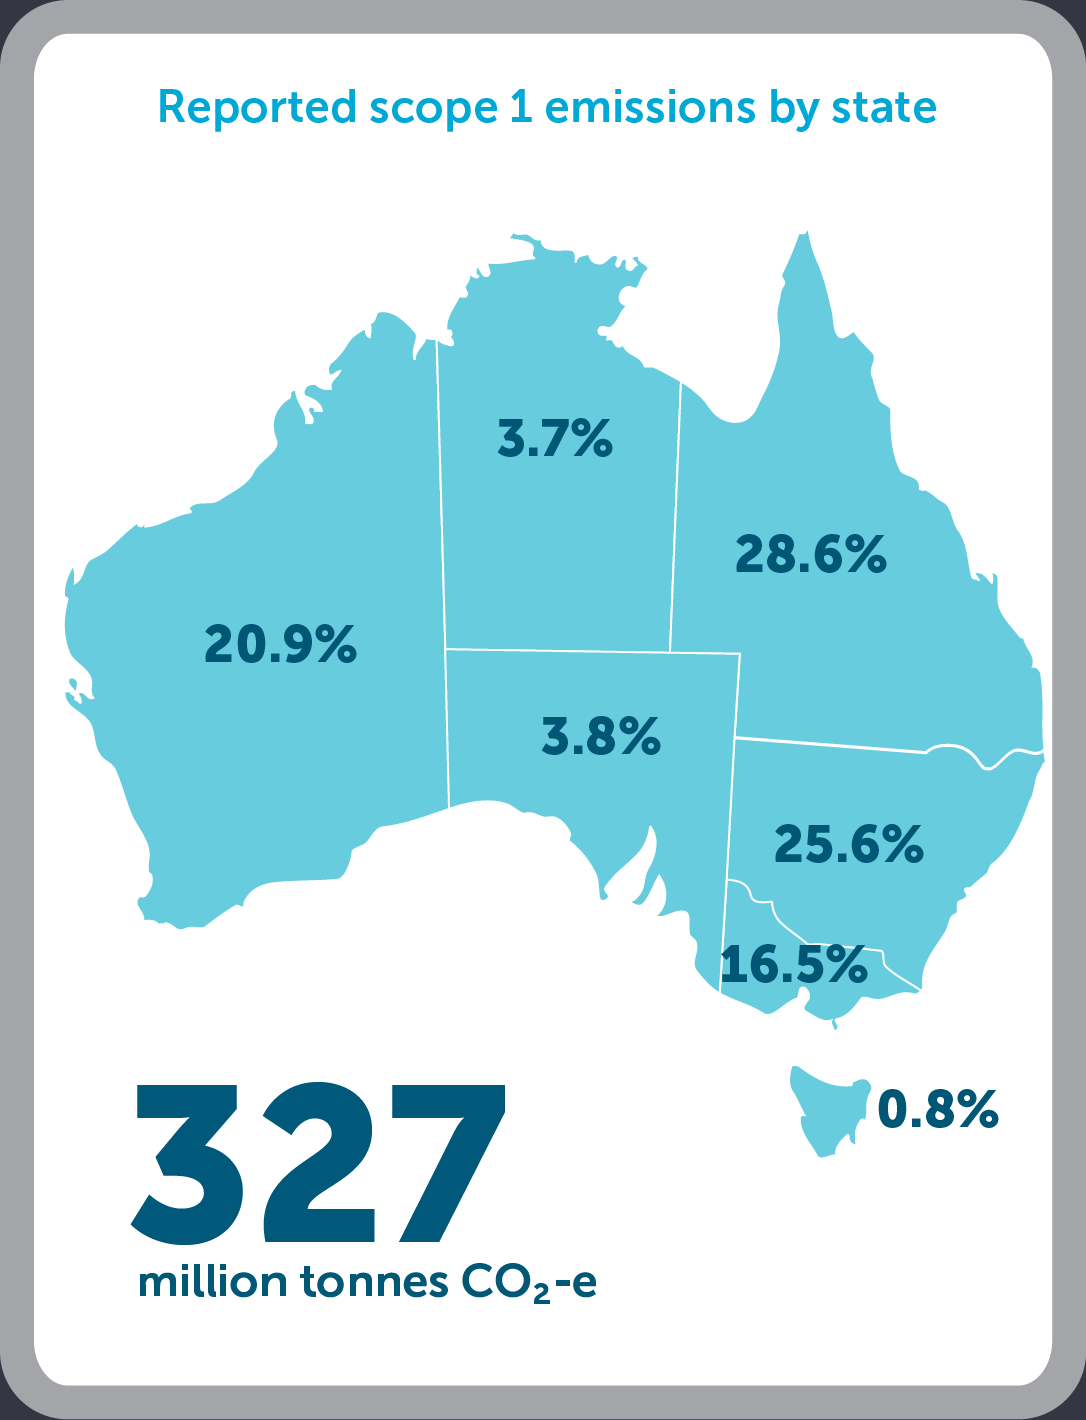
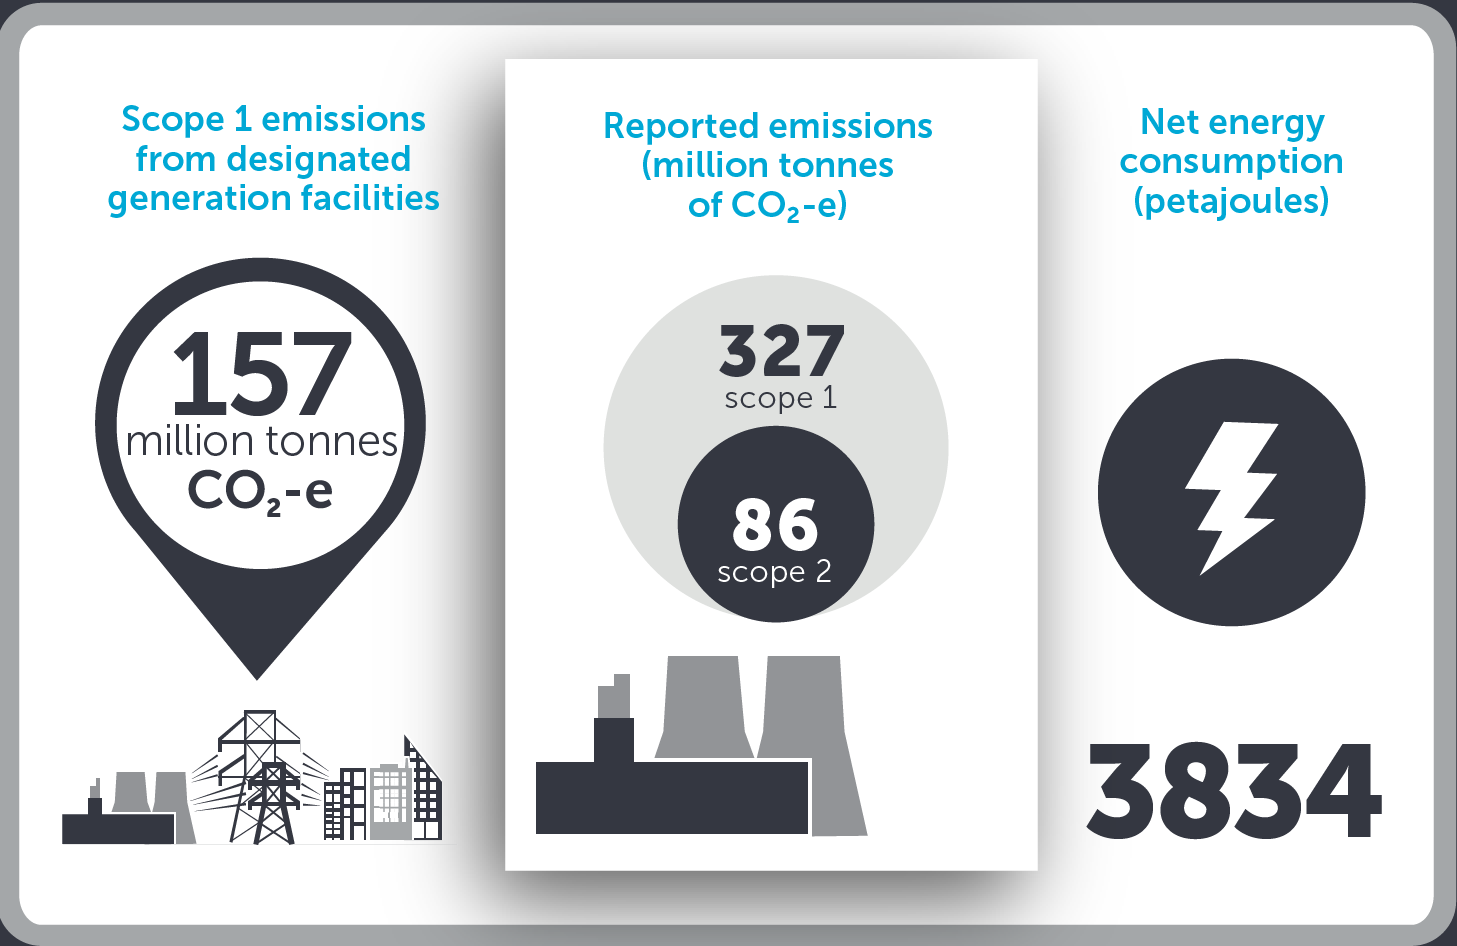
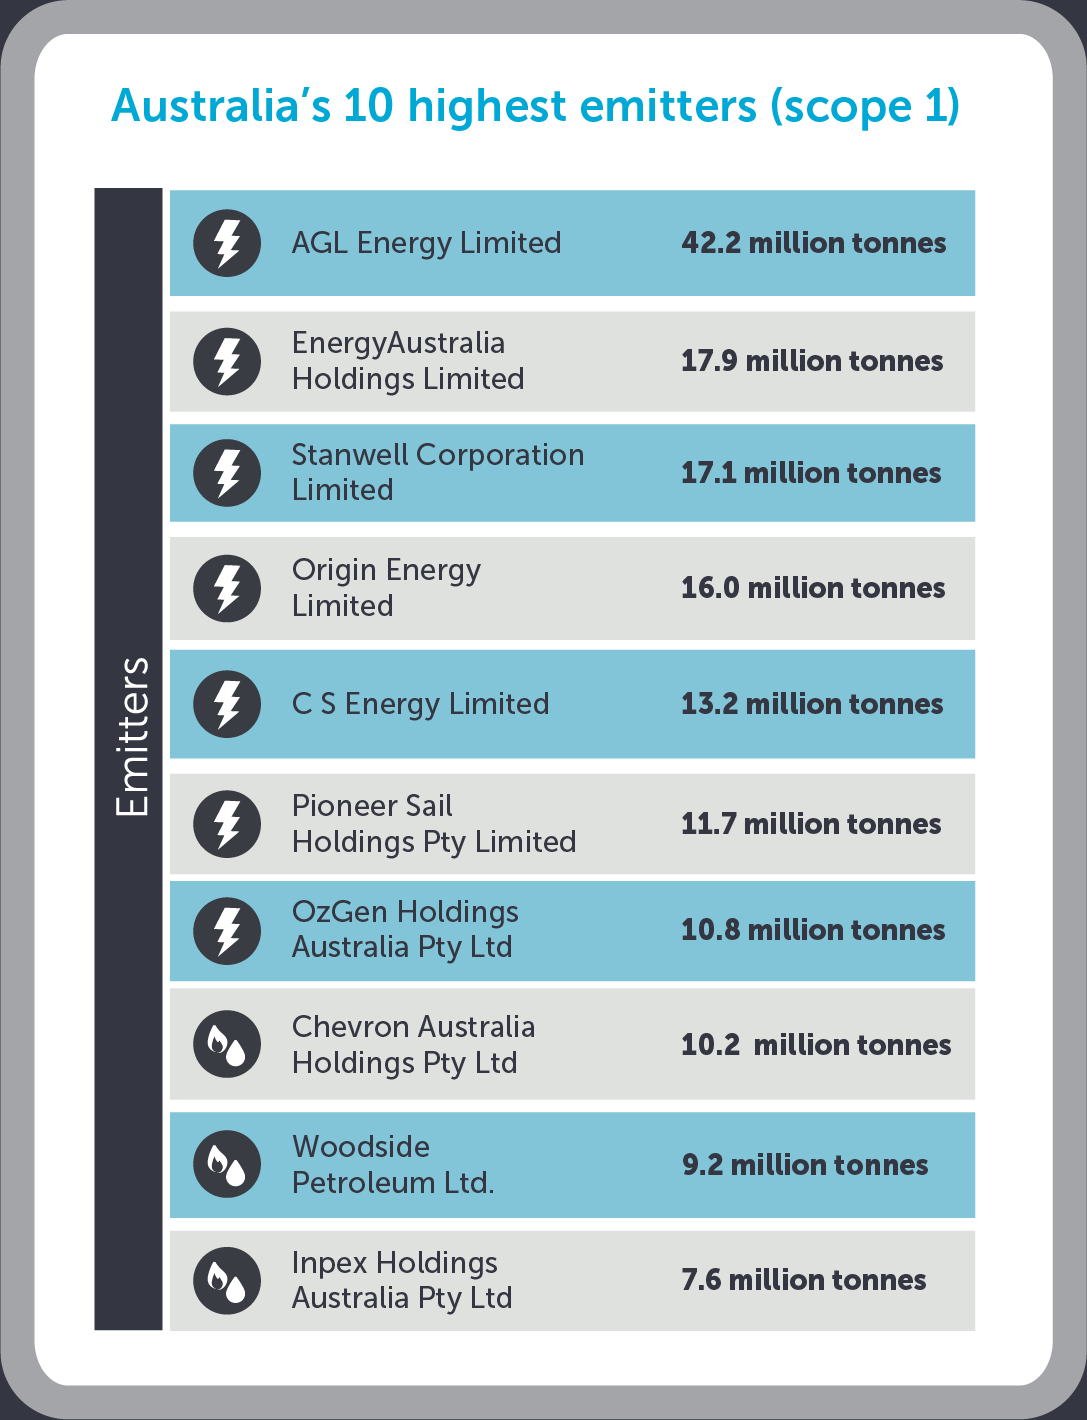
- 327 million tonnes of direct scope 1 greenhouse gas emissions (carbon dioxide equivalence)
- 86 million tonnes of indirect scope 2 greenhouse gas emissions (carbon dioxide equivalence), and
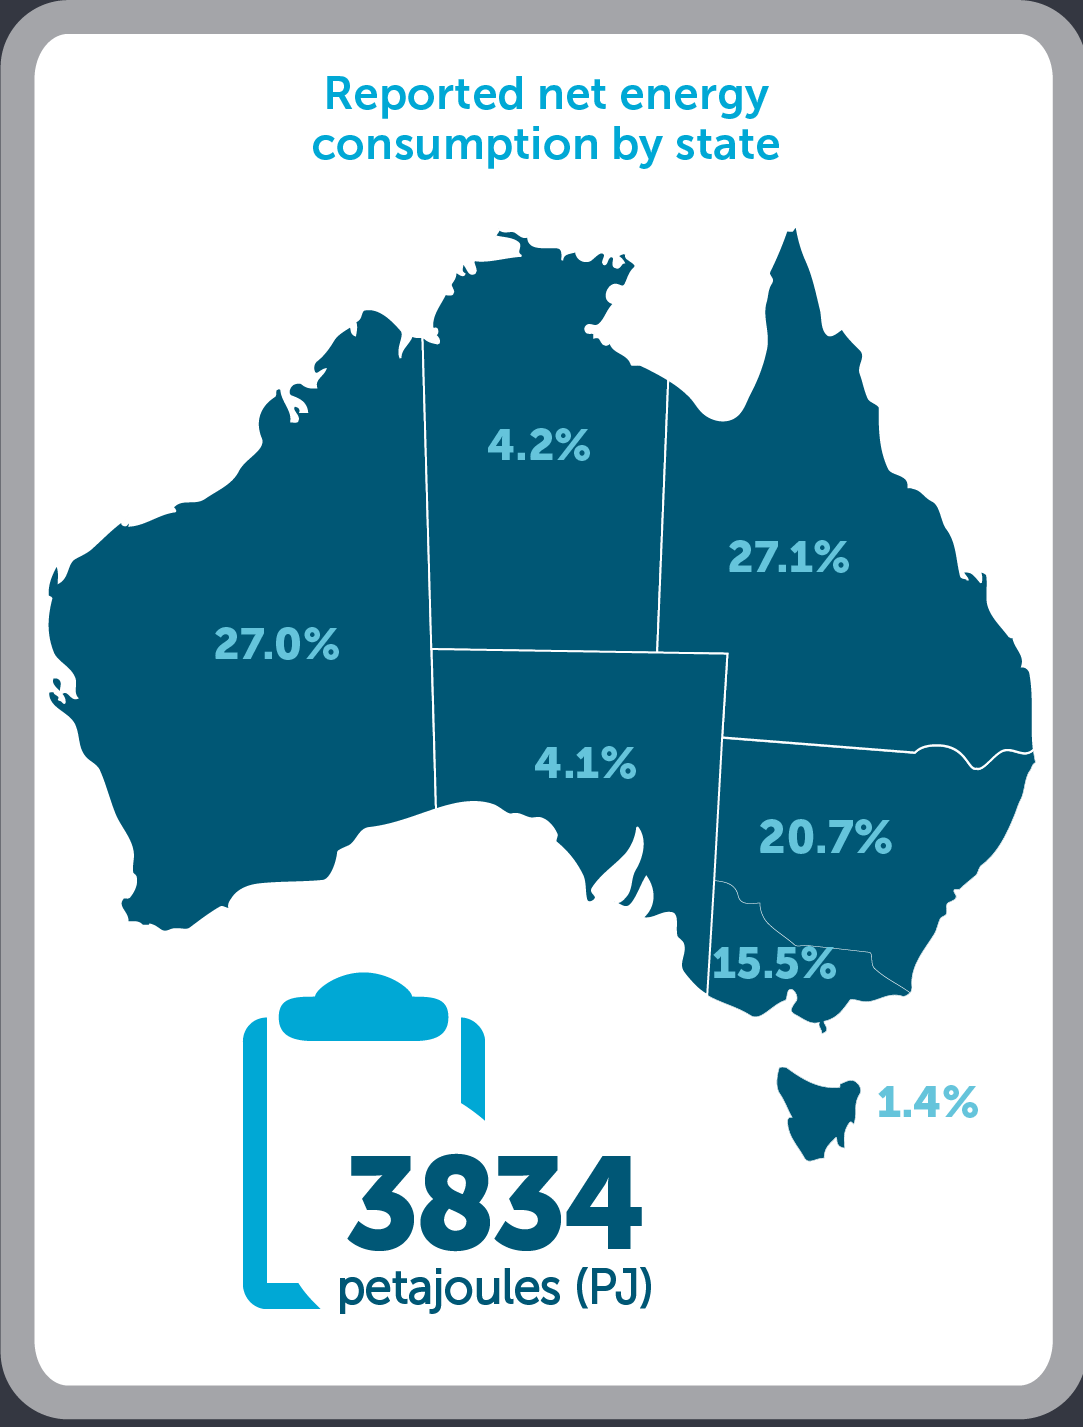
- 3,834 petajoules net energy consumed.
Data highlights
Click on the image below to view the PDF.


NGER highlights infographic 2019–20
Highlights in the 2019–20 data (in comparison to last year’s data) include:
- The total reported scope 1 emissions declined by 3% or 10.1 million tonnes.
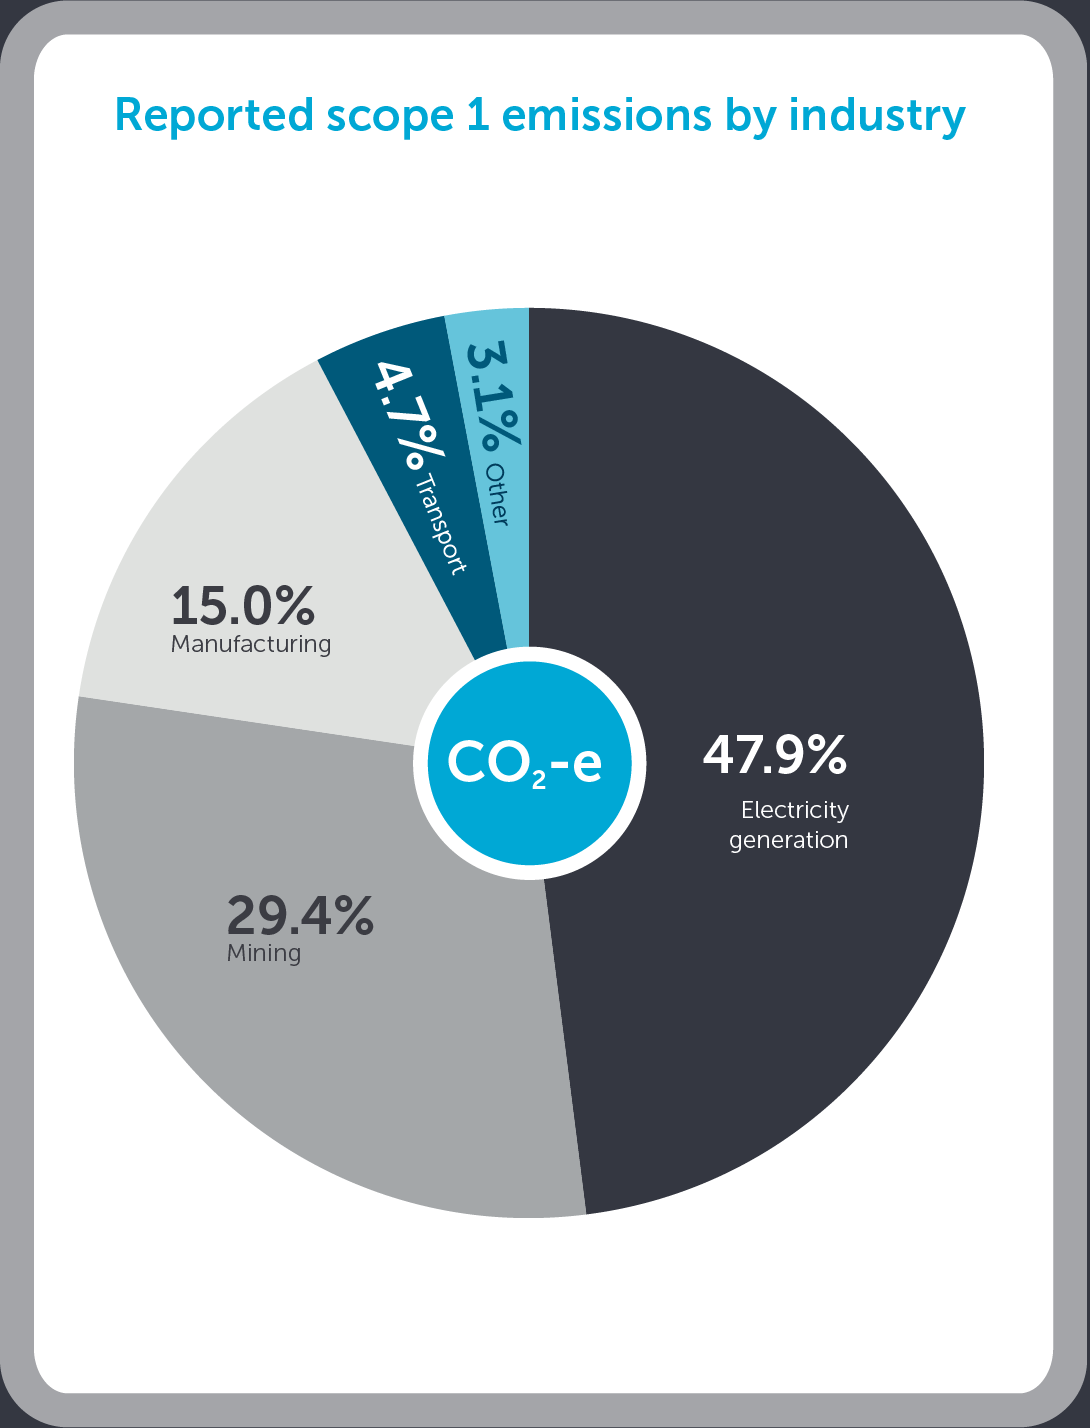
- This decline is largely due to decreases in emissions from electricity generation and oil and gas production.
- Emissions in the electricity sector have decreased by 4.6% or 7.5 million tonnes.
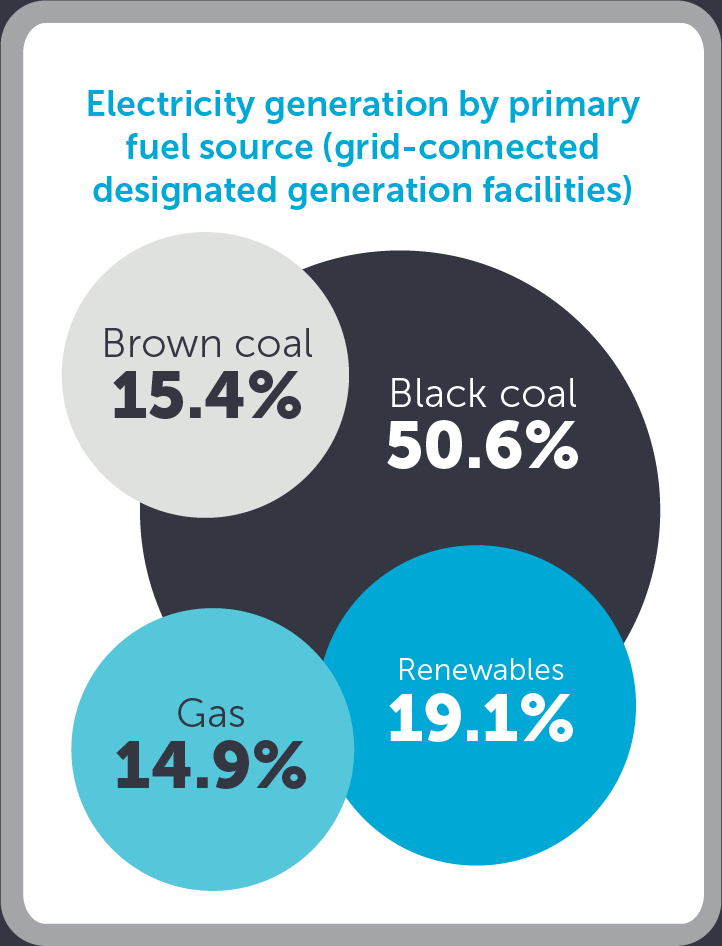
- This reduction is largely due to the increased use of renewable energy (such as solar generation) and the decreased use of black coal.
- Emissions from oil and gas and LNG decreased by 7% or 3.4 million tonnes.
- This reduction is largely due to reduced venting and flaring across the sector, despite overall production increases.
- Emissions in the transport sector decreased by 6.4% or 1 million tonnes.
- This reduction is largely due to reduced domestic flights resulting from the COVID-19 pandemic.
2019–20 datasets
- Corporate emissions and energy data 2019–20
- Reporting transfer certificate holders 2019–20
- Electricity sector emissions and generation data 2019–20
- National Greenhouse and Energy Register 2019–20
2019–20 published data spotlights
The following spotlights focus on key data released as part of the 2019–20 data publication.