
On 28 February 2019, the Clean Energy Regulator published the annual National Greenhouse and Energy Reporting data for the 2017–18 reporting year.
For the 2017–18 year, corporations reported a total of:
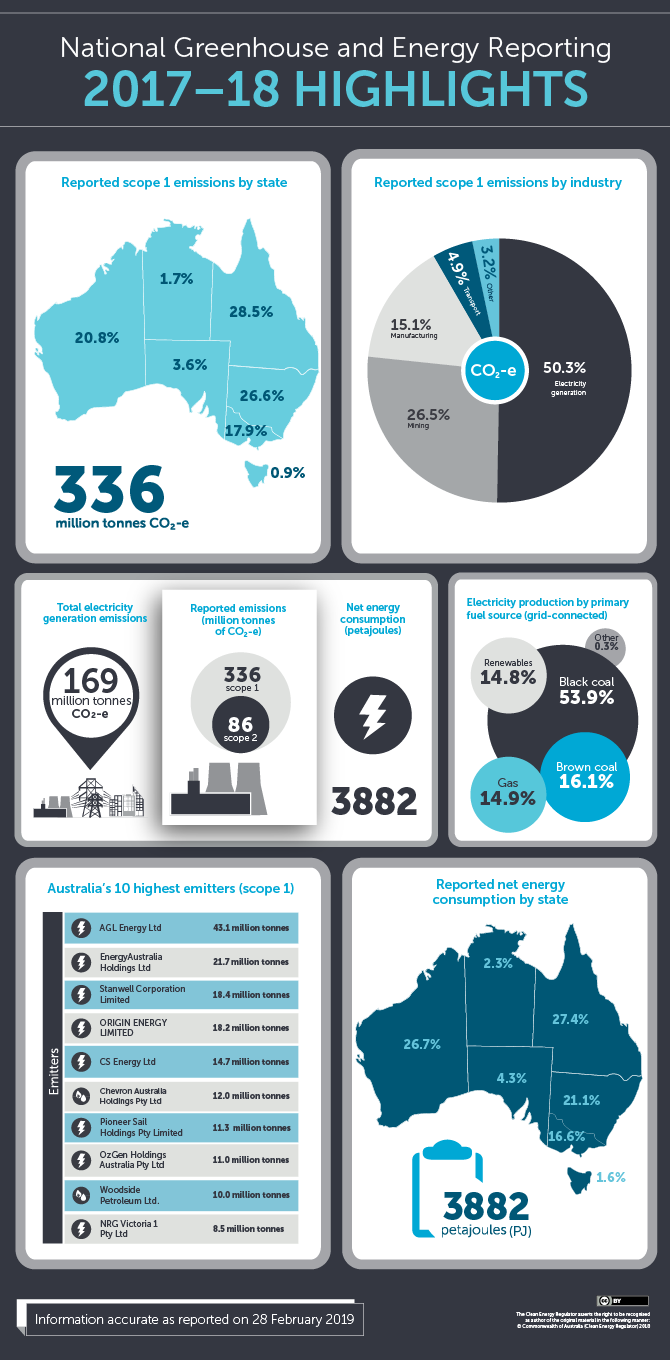
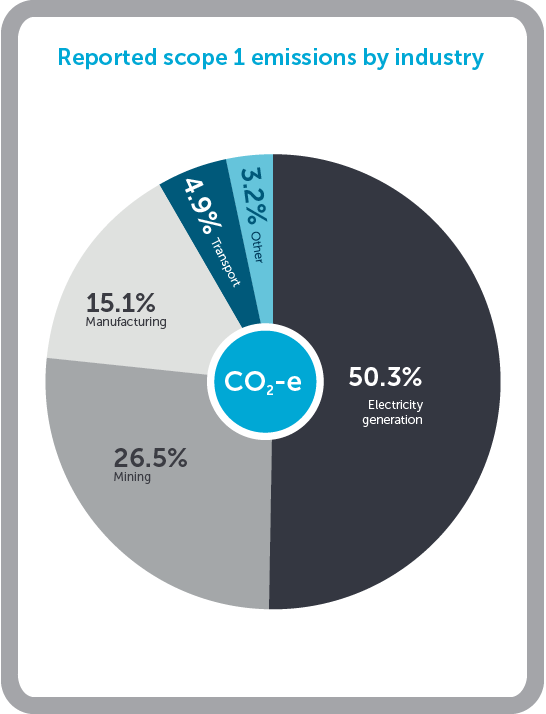
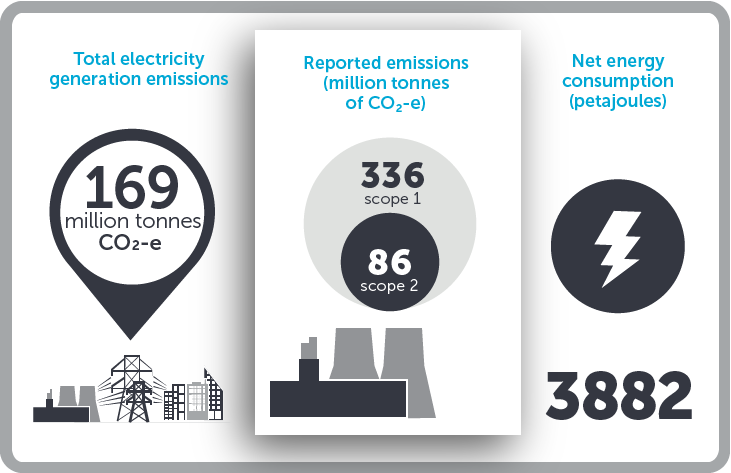
- 336 million tonnes of scope 1 greenhouse gas emissions (carbon dioxide equivalence)
- 86 million tonnes of scope 2 greenhouse gas emissions (carbon dioxide equivalence), and
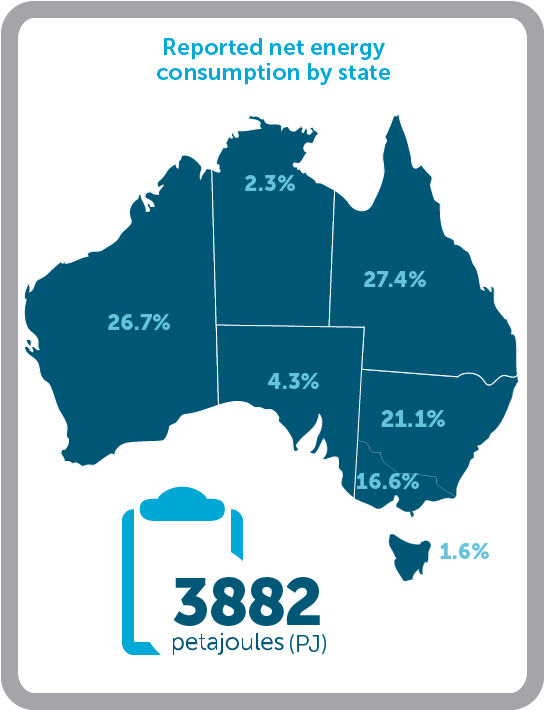
- 3882 petajoules net energy consumed.
Data highlights
Click on the image below to view the PDF


NGER Factsheet - Highlights infographic 2017-18
- Scope 1 emissions grew slightly to 336.3 million tonnes (carbon dioxide equivalent), an increase of 0.8 million tonnes (or 0.2 per cent) on adjusted 2016–17 levels, representing the overall rate of growth in emissions has slowed. Scope 1 emissions are sometimes referred to as direct emissions and are the direct result of an activity, or series of activities, at a facility; and scope 2 emissions, or indirect emissions, are from the indirect consumption of an energy commodity.
- The increase in emissions was largely due to increases in the liquefied natural gas (LNG) and oil and gas production sectors (4.1 million tonnes) and coal mining (1.3 million tonnes). This was offset by a decrease in emissions in the electricity generation sector of 6.8 million tonnes.
- The increase in emissions in the liquefied natural gas (LNG) and oil and gas production sectors can largely be attributed to an increase in production in LNG for export in Western Australia.
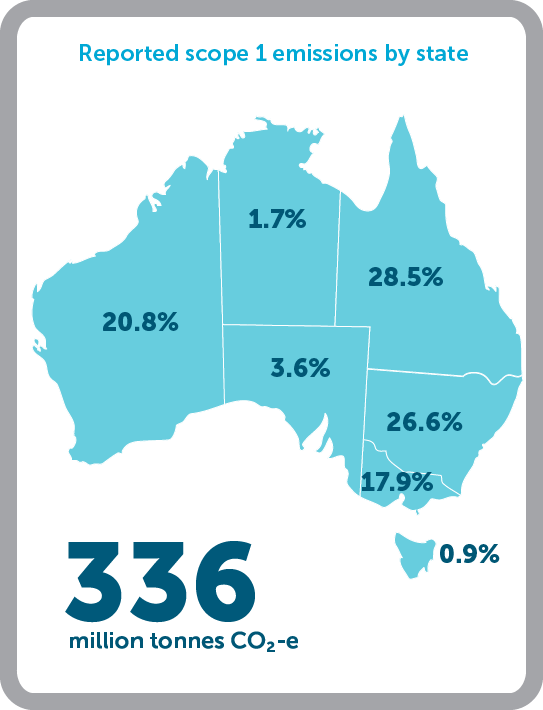
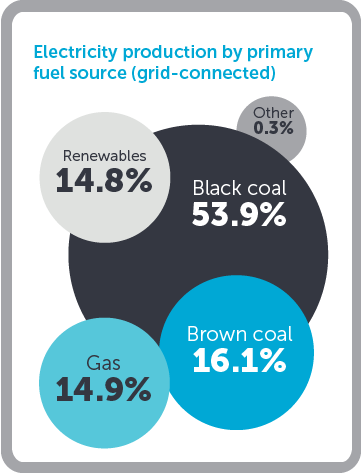
- The decrease in emissions in the electricity generation sector was largely due to a reduction in electricity production from brown coal and the closure of the Hazelwood power station, and an overall reduction in emissions intensity across the sector—partly a result of fuel switches from brown coal to black coal and an increase in production from renewables. However, the electricity generation sector remains the largest contributor to total emissions—accounting for over half (50.3 per cent) of all reported scope 1 emissions.
2017–18 datasets
Datasets published for the 2017–18 reporting year include:
- Registered controlling corporations report 2017–18
- Reporting transfer certificate holders report 2017–18
- Designated generation facilities report 2017–18
- Extract of the National Greenhouse and Energy Register 2017–18
It is important to note that information published as part of the 2017–18 National Greenhouse and Energy Reporting dataset cannot be directly compared to publications from previous years for a number of reasons, including updates made to previously published totals to account for report resubmissions. The Clean Energy Regulator takes all reasonable efforts to ensure the information published on its website is accurate at the time of publication.
See more information about what data is published and why.
2017–18 published data factsheets
A series of factsheets are available, which focus on some of the key data released as part of the 2017–18 data publication.
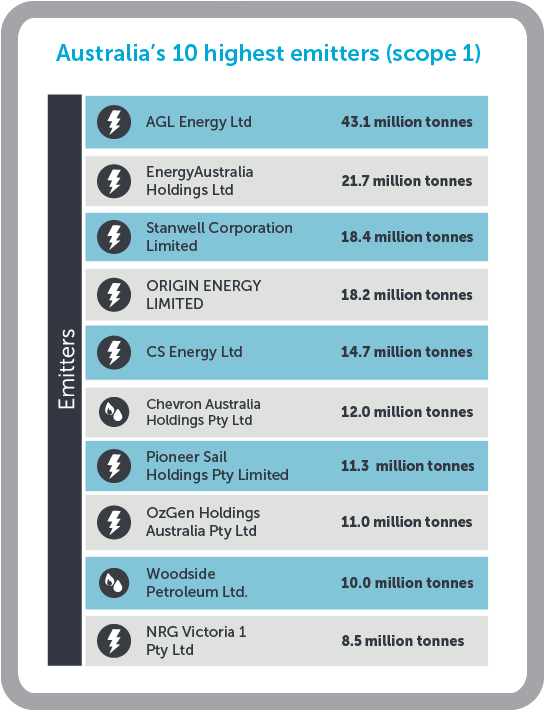
- Australia’s 10 highest greenhouse gas emitters 2017–18
- State and territory emissions profile 2017–18
- Australia’s largest electricity generators 2017–18
- Electricity generation sector emissions reported over time
Notes for the 2017–18 publication
- Industry groupings are based on the ANZSIC codes reported for each facility.
- ‘Mining and Manufacturing’ aligns with the ANZSIC divisions B – Mining, and C - Manufacturing respectively.
- ‘Transport’ includes the ANZSIC subdivisions Road, Rail, Water, Air and Space and Other Transport.
- Fuel source ‘Gas’ includes fuel types Gas, Waste Coal Mine Gas and Coal Seam Methane. Fuel source ‘Renewables’ includes Solar, Wind, Hydro, Landfill Gas, Biofuel, Bagasse and Biogas. Fuel source ‘Other’ includes Diesel, Kerosene and Battery fuel types. These are based the primary fuel consumed by a facility to generate electricity in a year, as published in the designated generation facilities report.
- ‘Electricity supply’ was changed to ‘Electricity generation’ for the 2017–18 reporting year, as it only includes ANZSIC group 261 and not Electricity Distribution or Transmission (ANZSIC 262 and 263 respectively).