
Key messages
- The first half of 2023 saw 526 megawatts (MW) of capacity reaching final investment decision (FID).
- We have downgraded expectations of new final investment decision in 2023 to 2.5 GW.
- 950 MW of new renewable energy capacity was approved for LGC creation in H1 2023.
- LGC prices rose 10% during the quarter to $54.50 reflecting a tighter market.
- Voluntary demand for LGCs for H1 is up 92% year on year.
Challenges keeps FID subdued
526 MW of new renewable energy capacity reached a final investment decision (FID) in the first half (H1) of 2023 (see Figure 2.1). We expected a slower start to the year following the near record year of investment in 2022.
Description
This graph shows the capacity of large-scale renewable energy to reach a final investment decision each quarter from 2016 to 2023.
This figure is interactive. Hover over/tap each bar to see the capacity in megawatts (MW). Hover over/tap the line to see the rolling average of the previous four quarters. Click/tap on the items in the legend to hide/show data in the figure.
Small print
The CER tracks public announcements and the above information may not be complete and may change retrospectively.
Data as at 5 July 2023.
Given the commercial nature of investment decisions, it is challenging to estimate the capacity for a year. In the Q1 2023 report, we said 3 to 3.5 gigawatts (GW) of new renewable capacity could reach FID this year. Recent industry engagement, including with projects in advanced stages of development, suggests it will be about 2.5 GW this year. The second half of the calendar year is expected to be larger than the first half. We advise caution in comparing quarterly FID data as these commercial decisions can be ‘lumpy’.
Commercial opportunities remain for renewable energy project developers. This includes replacing the earlier coal plant closures and contributing to the Australian Government’s target of 82% renewable energy generation by 2030. To achieve this goal, annual FID capacity needs to increase. However, there are challenges, including:
- Higher costs and workforce shortages. Higher new build costs are due to higher risk premiums, cost plus contracts rather than fixed costs and significantly more expensive component costs. The component and EPC contract costs are also materially higher than pre-pandemic levels. This is coupled with a high demand for construction services. Yet, new build utility wind and solar remain the cheapest form of energy on a levelised cost of electricity (LCOE) basis.
- Connection and transmission risks. New connection and potential generation curtailment risks plus potential marginal loss factor (MLF) changes are part of the perceived additional risk.
- Higher price power purchase agreements (PPAs). The increased cost and risks are flowing through to the PPAs prices. A higher price is needed on a per megawatt hour basis to get projects to FID. These higher prices may be leading to less demand for PPAs from electricity retailers and corporates.
- Reduced certainty of future revenue. There is an emerging trend towards shorter-term PPAs. This reduces certainty of future revenue, which may also be affecting investment decisions.
Investment in additional storage and transmission upgrades are required. This will help to de-risk future renewable generation investments. The Australian Energy Market Operator (AEMO) highlighted the need for more investment in transmission and storage to support investment in renewable energy generation and achieve the Australian Government’s 82% renewable goal and system reliability. Rystad highlighted that grid connection uncertainty was a material risk to reaching financial close. Renew Economy's big battery storage map of Australia shows many batteries are under construction. Eleven big battery projects with a capacity of 635 MW are due for completion by the end of 2024. The New South Wales-South Australia interconnector (Project EnergyConnect) is also due for completion by the end of 2024. The Australian Renewable Energy Agency (ARENA) has also provided funding under the 'Large Scale Battery Storage Round' to support 2 GW of grid-scale battery projects.
Discussions with some project developers yet to achieve FID indicate they continue to face challenges with social license and permitting. Obtaining social license is a necessary, but time-intensive process. It helps project developers to secure access to rural landholders’ land. However, the Australian Energy Infrastructure Commissioner has reported a decline in complaints about already operating and proposed projects.
The timing of state or federal policy announcements may be a factor in investment decisions. For example, the upcoming Capacity Investment Scheme auctions in Victoria and South Australia. Combined wholesale electricity and LGC prices are signalling a need for renewable energy investments. OpenNEM shows the average wholesale price for utility scale solar and wind in the National Electricity Market (NEM) in H1 2023 was $61 and $71, respectively. The LGC spot price finished H1 2023 at $54.50 and added a further $1.00 by mid-August.
The Renewable Energy Target (RET) has more than 7 years until the scheme finishes at the end of 2030. There is a proposed Guarantee of Origin scheme for hydrogen and renewable energy. Once legislated, it will provide a way for renewable energy projects to generate tradable certificates (renewable energy Guarantee of Origin certificates or REGOs). However, there is uncertainty on how the market may value REGOs beyond 2030.
Renewable energy generation in the NEM is on the rise
Renewables contributed 36.4% of total National Electricity Market (NEM) generation in H1 2023, up almost 4 percentage points from the same period in 2022, according to OpenNEM. The increased penetration of renewables in the NEM has contributed to lower emission intensity, now at 0.61 tonnes of carbon dioxide equivalent per megawatt hour (t-CO2-e/MWh) (see Figure 2.2).
Renewables generation share in the National Electricity Market (NEM)
2011 to 2023 Note: This figure is not interactive.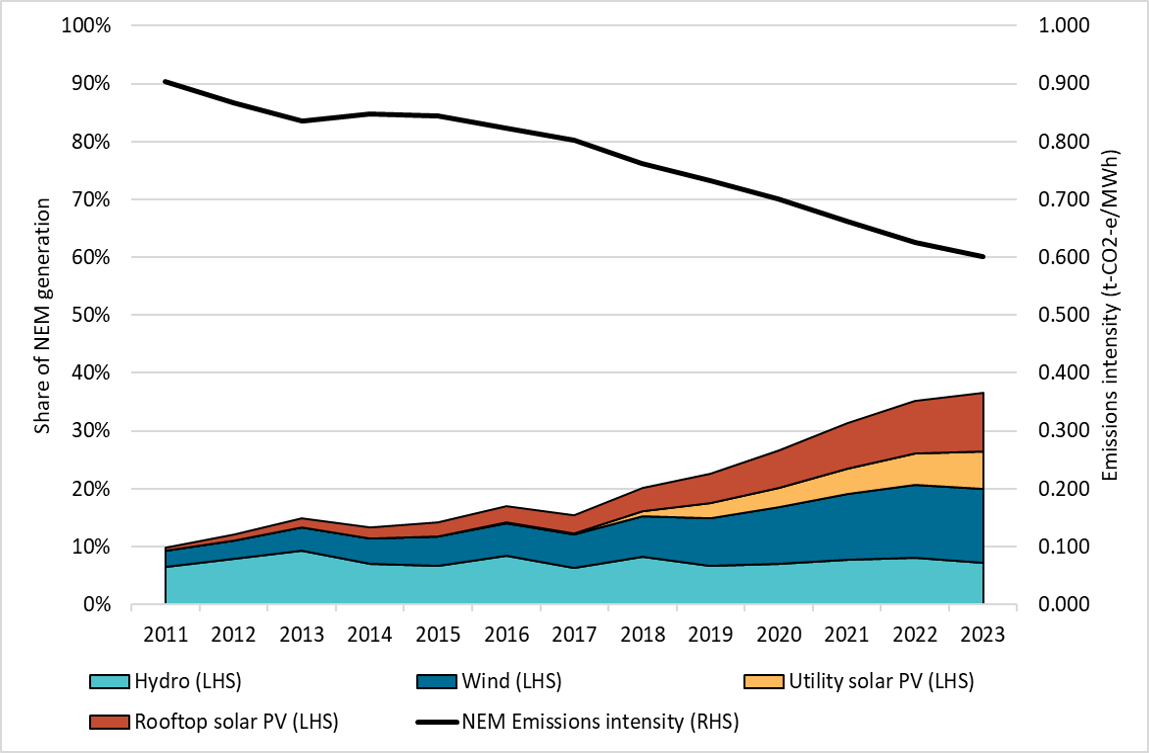
Description
This graph shows the share of generation contributed by renewables and the emissions intensity of the National Electricity Market (NEM). The NEM operates in New South Wales, the Australian Capital Territory, Queensland, South Australia, Victoria and Tasmania. It does not include Western Australia or the Northern Territory.
Small print
Generation and emissions intensity data sourced from OpenNEM on 3 August 2023. A small portion of renewable generation including biomass, is not shown.
Renewable energy is expected to average 40% of NEM generation by the end of 2023. About 2.8 GW of new large-scale wind and solar capacity is expected to reach first generation in 2023. This could step up again in 2024 with more than 3 GW of new capacity expected to start generating. There were significant investments in new renewable energy generating capacity in 2022, as discussed in chapter 2 of the Q1 2023 QCMR. We anticipate these investments to flow through to generating assets in 2025 to 2026. The current lag from construction to generation is about 1.5 years for large-scale solar and two years for wind projects. The lag is increasing as projects are becoming larger with longer lead times.
First generation estimates are based on projects with publicly announced construction and expected first generation dates. We directly engage with some developers to confirm progress. Our analysis should be treated as indicative and we will revise it in future reports as we receive new information. Our experience suggests some projects may be delayed while others will reach first generation earlier than planned.
We accredit the full capacity of a new renewable power station at the estimated time of first generation. This differs from AEMO, which recognises capacity in tranches ahead of it coming online. It may take some months for large power stations to ramp up to full generation. These differences in recognising future new capacity may result in different estimates between agencies, including between ours and AEMO.
It seems new annual wind and solar power station capacity reaching first generation may increase over the next few years but the outlook beyond that is more muted.
Voluntary cancellations increase to meet corporate net zero goals
Non-RET LGC cancellations increased in the first half of 2023 to 5.2 million. This is up from 1.6 million in the same period in 2022 (see Figure 2.3). The ACT government cancelled 2.2 million LGCs against its 100% renewable electricity target in Q2 2023, while in 2022 this occurred in Q3. Excluding the ACT government surrender, voluntary demand is still up 92% year on year.
A wide range of organisations cancelled LGCs in H1 2023, including:
- Large Australian retailers that cancelled more than 400,000 LGCs.
- Multinational companies and banks that also made substantial voluntary cancellations.
- Australian universities that exceeded 330,000 LGCs, up from about 176,000 in the same period last year.
- Local governments and transport.
This reflects the growing importance of voluntary net zero and renewable energy commitments in the private sector. Further demand is expected from GreenPower and corporate renewable energy commitments in the second half of 2023. We expect total cancellations for 2023 to be materially higher than our estimate of 8 million in chapter 3 of the Q1 2023 QCMR.
Description
This graph shows large-scale generation certificate (LGC) cancellations by demand source from 2019 to 2023. Annual demand from corporates and local, state and territory governments has been increasing over time.
This figure is interactive. Hover over/tap each segment to see the number of cancellations. Click/tap on the items in the legend to hide/show data in the figure.
Small print
| Classification | Covered activities |
|---|---|
| Voluntary demand | Cancellations made against voluntary certification programs such as Climate Active, and any sort of organisational emissions or energy targets. |
| Local, state and territory government demand | Cancellations on behalf of local, state and territory governments, for example to offset emissions from state fleets or meet emissions reduction targets. |
| Compliance demand | Cancellations by private organisations and corporations for compliance or obligations against municipal, local, state and territory government laws, approvals, or contracts. For example, to meet Environmental Protection Agency requirements. |
| Other demand | All activity not covered in the previous categories, primarily due to lack of information available. This grouping has declined substantially as part of these new classifications. |
This classification system is uniform across ACCU and LGC cancellations.
Programs such as GreenPower and Climate Active recognise the cancellation of LGCs to prove renewable electricity use. This is known as market-based scope 2 carbon accounting. LGCs are an important source of voluntary cancellations as evidenced in the Corporate Emissions Reduction Transparency (CERT) report 2023. The report highlights the progress 25 large Australian companies from a broad cross section of the economy are making to reduce emissions. Notably, cancellation of LGCs were a significant part of some companies’ net zero strategy. Five companies have already reached 100% renewable electricity use. Total cancellation of LGCs increased by 274% to 1.3 million compared to the previous reporting period.
The second consultation on Treasury’s climate related financial disclosure closed on 21 July 2023. Treasury proposes to phase in mandatory disclosure of market-based scope 2 emissions by 2027-28. This could be a key driver of non-RET demand for LGCs in the future.
LGC market dynamics
LGC spot prices rose 10% during Q2 2023 from $49.25 to $54.50 (see Figure 2.4). The spot price reached a high of $58.50 in early June 2023. All LGC vintages also traded up across the quarter.
Large-scale generation certificate (LGC) reported spot and forward prices
July 2022 to July 2023 Note: This figure is not interactive.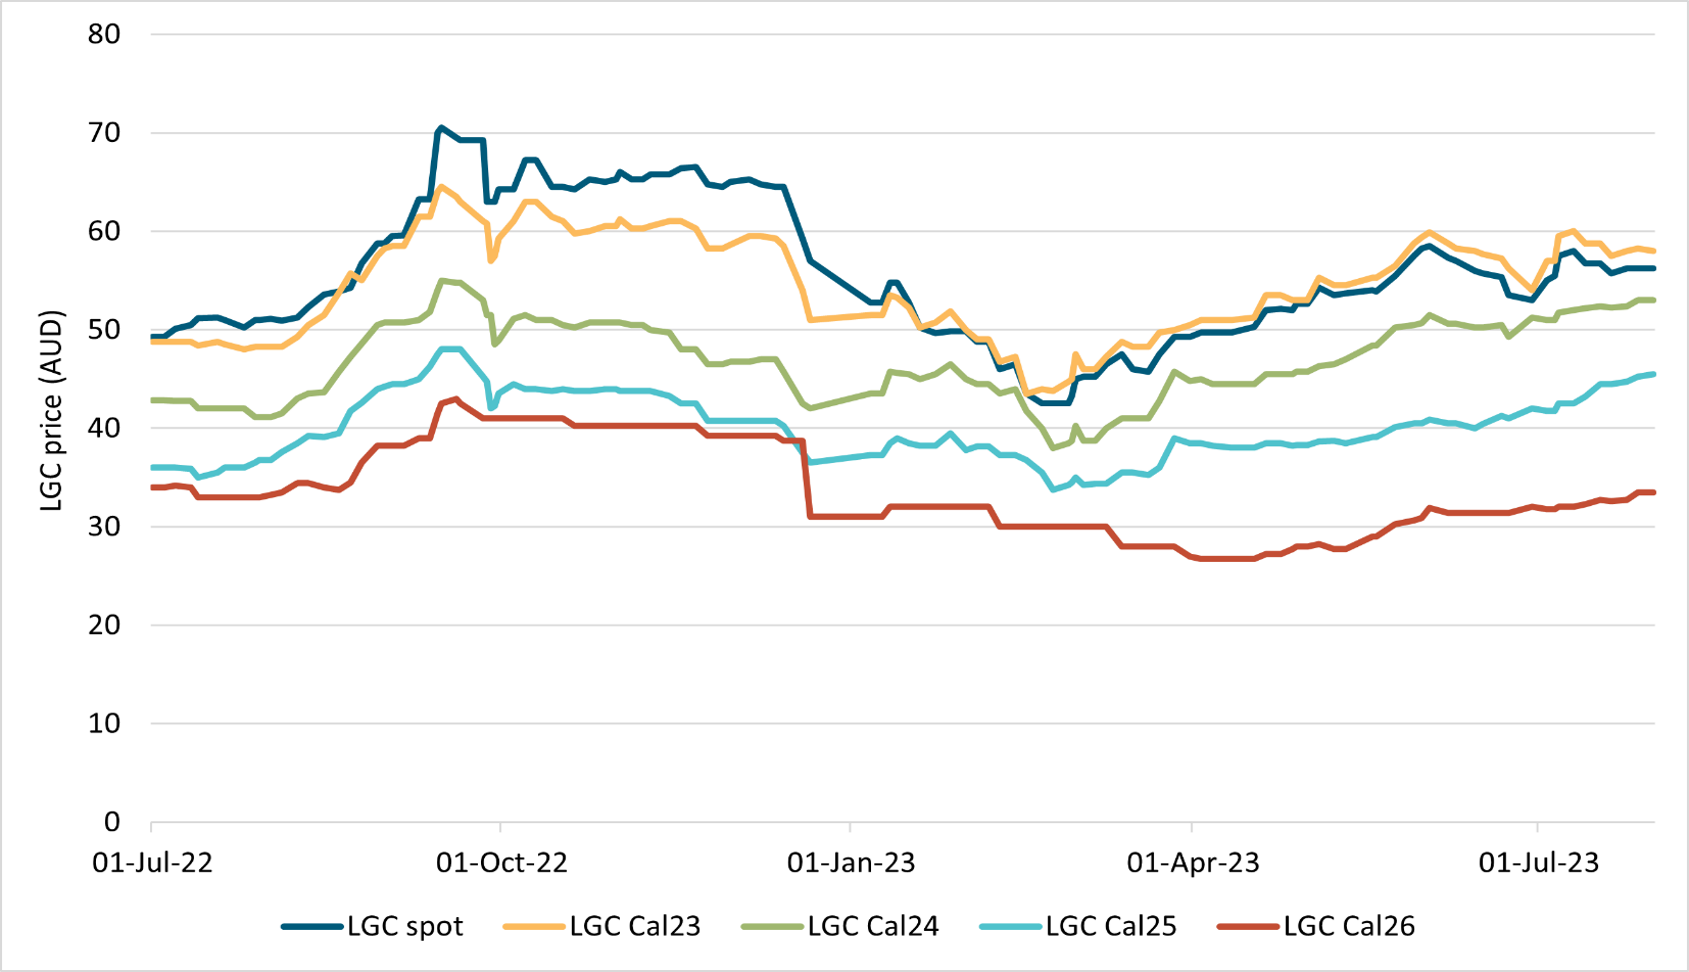
Description
This graph shows the LGC spot and forward prices over the last 12 months.
Small print
Pricing data is compiled from trades reported by CORE markets, and may not be comprehensive.
A key factor at play is ongoing shortfall taken and expected shortfall charge redemption (see Q4 2022 QCMR for an in-depth discussion) and the effective 12.4 million LGC deficit. The other important demand side factor is increasing voluntary cancellations of LGCs to prove use of renewable electricity.
On the supply side it was a strong H1, with 24 million LGCs created, a 21% increase from H1 2022. This follows 950 MW new renewable generating capacity approved for LGC creation in H1 2023, a 35% increase over H1 2022. Notably, no wind power stations were approved in H1 2023. At the end of H1, a combined 1,100 MW of capacity from renewable power stations is under assessment. Sixty-five per cent of this capacity is from wind projects. We expect that LGC supply will be 48 to 50 million in 2023. This would be a 14-19% increase compared to 2022.
Supplementary figures
Large-scale generation certificate (LGC) spot price
January 2015 to July 2023 Note: This figure is not interactive.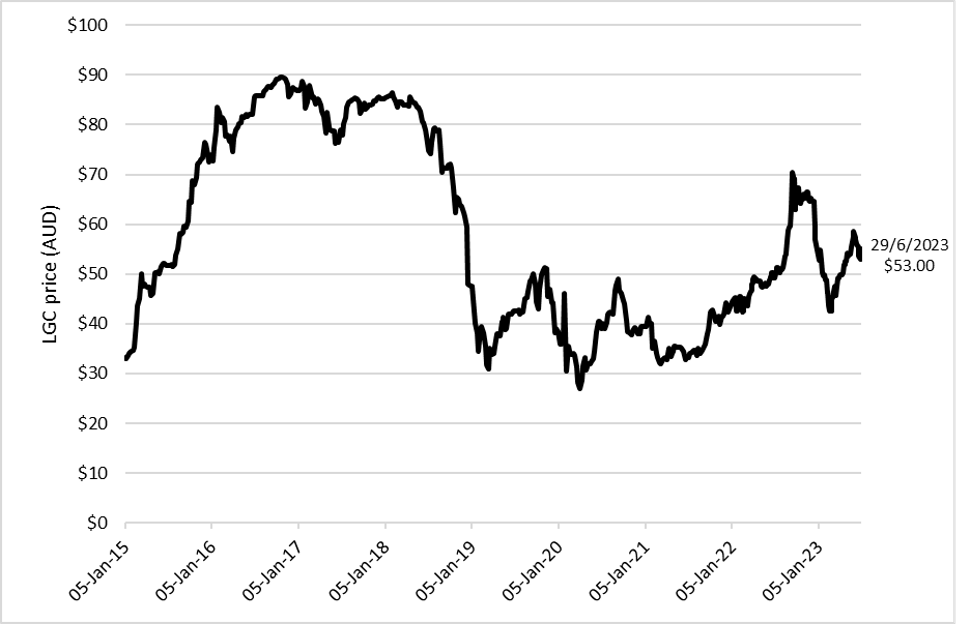
Description
This graph shows the LGC spot price from 2015 to 2023.
Small print
Pricing data is compiled from trades reported by CORE markets, and may not be comprehensive.
Figure 2.6
Description
This graph shows the number of LGCs validated by technology type for each quarter.
This figure is interactive. Hover over/tap each segment to see the number of LGCs in millions. Click/tap on the items in the legend to hide/show data in the figure.
Small print
Waste Coal Mine Gas is no longer eligible to create LGCs as of 2021. Any 2021 validations reflect LGCs that were created prior to 2021.
Description
This graph shows the combined large-scale generation certificates (LGC) spot and National Electricity Market (NEM) wholesale price for large-scale wind and solar PV generation.
This figure is interactive. Hover over/tap along the lines to see the capacity in megawatts (MW) or the revenue per megawatt hour (MWh) in Australian Dollars (AUD). Click/tap on the items in the legend to hide/show data in the figure.
Small print
National Electricity Market (NEM) data sourced from OpenNEM. LGC spot price sourced from TFS Green. Final investment decision data sourced through open source monitoring on announcements and by cross checking with independent industry analysts and directly with project developers.